
Staten Island Real Estate:
What February Tells Us
About the Market Ahead
Staten Island, NYRichmond County MLS5 min read
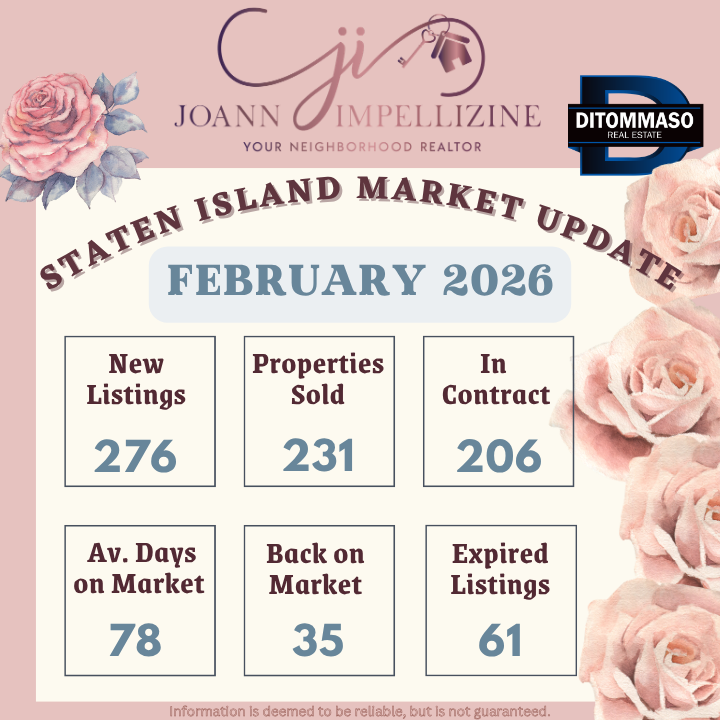
February's numbers are in — and they paint a clear picture of a market that rewards preparation, punishes overpricing, and continues to move for buyers and sellers who understand the data.
Across Richmond County, 231 homes closed in February 2026 with a combined sales volume of $176.7 million. The median sold price landed at $710,000 — and sellers, on average, walked away with 96.9% of their asking price. That figure isn't just a statistic. It's a reflection of how precisely the market is calibrating value right now.
Here's what the full picture looks like — and what it means for you.
Median sold price$710K231 homes closed
Sale / list price96.9%Near full asking price
Total sold volume$176.7MAvg. $765,046
The Market Is Moving — For the Right Homes
The 65-day average time on market for sold listings tells an interesting story. Homes that were priced correctly — positioned to reflect actual comparable sales rather than aspirational numbers — found buyers. Those that weren't are still waiting.
The 61 listings that expired in February averaged 173 days on the market. That's nearly six months of carrying costs, market fatigue, and missed opportunity — almost all of it preventable with a different pricing strategy from day one.
"A home priced to the market closes. A home priced above it sits — and sits — until the seller accepts what the market was always willing to pay."
This isn't a criticism of those sellers. It's a pattern visible in every market cycle, and it's one of the most important conversations I have with my clients before we go to market.
Buyer Activity Remains Strong
Despite higher mortgage rates compared to a few years ago, buyer activity on Staten Island is healthy. February saw 276 new listings enter the market — and 206 of them moved to pending within the month. That's a tight ratio that speaks to genuine demand, not just browsing.
The 596 homes currently active carry a median ask of $799,000, which gives buyers meaningful options across price points. But with absorption moving the way it is, well-positioned listings aren't sitting long.
February activity snapshot
| Category | Count | Median price | Avg. DOM |
|---|---|---|---|
| Closed sales | 231 | $710,000 | 65 days |
| New listings | 276 | $799,000 | 26 days |
| Pending | 206 | $749,999 | 62 days |
| Currently active | 596 | $799,000 | 103 days |
| Expired listings | 61 | $689,888 | 173 days |
What This Means If You're Thinking About Selling
The conditions are favorable — but they are not forgiving of mispricing. With sellers receiving 96.9% of their list price at closing, homes that are accurately priced are commanding nearly full value. The spread between median list price ($725,000) and median sold price ($710,000) among closed sales is slim — just $15,000. That tells you buyers are making legitimate, market-informed offers, and sellers who price accordingly are closing.
Key takeaway for sellers
Pricing strategy is the single greatest lever you control. The data from February shows a clear divide: homes that are priced to the market close in an average of 65 days at 96.9% of ask. Homes priced above market take 173 days and ultimately don't close at all. The difference isn't luck — it's strategy.
What This Means If You're Thinking About Buying
The inventory picture is improving. With 276 new listings entering in February and 596 currently active, buyers have more to work with than they did in the tighter inventory environment of 2023 and 2024. That said, the well-priced homes at the median price point are still moving competitively — so coming in prepared, pre-approved, and clear on your priorities remains essential.
The pending-to-new-listing ratio also signals that this isn't a buyer's market in the traditional sense. Sellers are not desperate. But neither are they immune to the market's pricing discipline. There's negotiating room — especially on listings that have been sitting — but it requires knowing where to look and how to structure an offer.
Looking Ahead
February's data suggests a market that is balanced, active, and still price-sensitive. As we move deeper into spring — traditionally the busiest season for real estate on the Island — the expectation is that new inventory will continue to flow and buyer activity will pick up further. Whether that tips the balance toward buyers or sellers will depend on how many listings come to market and how they're priced.
The fundamentals here remain strong. Staten Island continues to attract buyers looking for space, community, and value relative to the rest of New York City. For those who are positioned well — with the right pricing, the right preparation, and the right guidance — this remains one of the better times to transact in recent memory.
If you'd like to understand what these numbers mean for your specific home, neighborhood, or situation, I'm always happy to talk through it.
Ready to make your next move?
Whether you're buying, selling, or simply exploring your options,
let's start with a conversation — no pressure, just perspective.
Schedule a ConsultationCheck out this article next

What Zillow, Redfin, And Algorithms Can’t Tell You
Online home valuation tools can be a quick and easy way to get a ballpark estimate of what a property is worth. However, buyers and…
Read Article