
July 2026 Staten Island Real Estate Market Update
July 2026 Staten Island Real Estate Market Update
Strong Sales Activity, Stable Prices, and Competitive Buyer Demand
The Staten Island real estate market remained active in July 2026, with strong closed-sale activity, steady pricing, and continued competition for well-positioned homes.
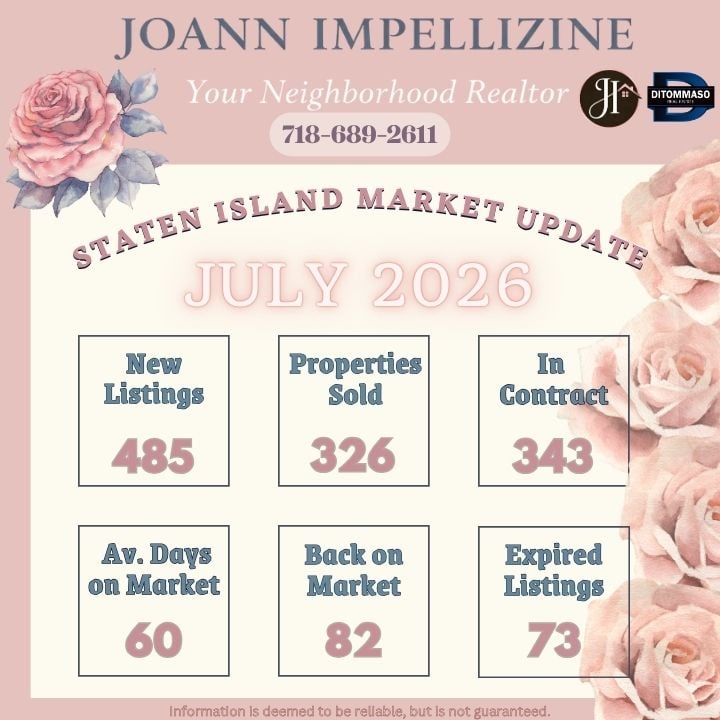
According to the latest MLS statistics, 326 homes sold in July, with a median sold price of $750,000. Homes spent an average of 60 days on market, while the average sale-to-list ratio reached 100.84%.
July 2026 Market Snapshot
Closed Sales Increased
July finished with 326 closed sales, showing strong transaction activity across Staten Island. The market also recorded 343 pending properties, suggesting that buyer activity remained healthy heading into August.
For sellers, this level of activity is encouraging. Buyers are still making decisions and moving forward, especially when a home is positioned correctly from the beginning.
Median Home Price Held at $750,000
The median sold price was $750,000 in July. The median list price for sold properties was $749,999, showing very close alignment between asking prices and final sale prices overall.
That kind of pricing consistency can be encouraging for homeowners considering a sale, but it also reinforces the importance of setting the right list price from day one.
Homes Sold Above List Price on Average
One of the most notable July statistics was the 100.84% sale-to-list ratio.
That means closed properties sold for slightly more than their list price on average. This does not mean every home received multiple offers or sold above asking, but it does show that competitive buyer demand remains present in the Staten Island market.
For sellers, strong results are still possible — especially when accurate pricing, thoughtful preparation, and effective marketing work together.
Inventory Continues to Give Buyers Options
July brought 485 new listings to the market, while 985 properties were listed as current active inventory when the report was generated.
That gives buyers more homes to compare. For sellers, increased inventory means there is more competition for attention, making presentation, pricing, photography, and online exposure increasingly important.
Days on Market Remained Steady
Homes spent an average of 60 days on market in July.
Buyers are still active, but they have options and are evaluating price, condition, location, and overall value carefully. That makes the first few weeks on the market especially important for sellers.
What This Means for Sellers
July's numbers continue to support sellers who approach the market strategically. Homes that are priced realistically, prepared well, and marketed professionally can still attract strong buyer interest and competitive offers.
However, buyers now have more options. Sellers cannot rely on market conditions alone — presentation, pricing, exposure, and negotiation strategy all matter.
What This Means for Buyers
Buyers have more properties to consider, but competition still exists for desirable homes. The July sale-to-list ratio shows that well-priced properties can continue to generate strong interest.
Buyers should be prepared to act decisively when they find the right home, while also using the available inventory to compare value carefully.
Joann’s Market Insight ✦
July's market showed a healthy balance of activity and competition. Closed sales increased, the median sold price remained strong at $750,000, and homes sold above list price on average.
At the same time, buyers still had nearly 1,000 active listings to choose from. That combination tells me this is not a market where every home will automatically perform the same. The strongest results are still going to homes that are priced correctly, prepared thoughtfully, and marketed with a clear strategy from the beginning.
Thinking About Selling?
If you're considering selling your Staten Island home this year, market-wide statistics are a useful starting point — but your property's value depends on much more than borough-wide averages.
Your neighborhood, condition, upgrades, recent comparable sales, competition, and current buyer demand all play a role in determining value and the right listing strategy.
Curious What Your Staten Island Home Is Worth?
Get a personalized home valuation based on current market conditions, neighborhood activity, recent comparable sales, and your home's unique features.
Request Your Home Value →Follow Staten Island Market Trends Month by Month
Visit my Staten Island Real Estate Market Reports page to compare monthly home prices, sales activity, inventory trends, and local market insights.
View Monthly Market Reports →Check out this article next

Mortgage Rates Changed Less Than You Think
Mortgage rates have remained more stable than many headlines suggest. Explore the one-year trend and discover what today's rate environment means for Staten Island home…
Read Article